
The share of the elderly population (65+) in Africa has increased from about 3.3% in 1990 to 3.7% in 2021, or from about 21 million in 1990 to 50 million in 2021[1]. This is largely due to improvements in life expectancy driven mainly by increased access to modern health care systems, and in some cases improvements in living conditions. However, for most African countries, economic conditions have not been conducive for the elderly. This brief provides an insight into the key drivers of the ageing population in Africa and indicate the path for policy in caring for the elderly.
Trends in the size of the elderly population in Africa
There is a significant variation in the trend of the ageing population across sub-regions (Figure 1). North Africa has exhibited rapidly growing ageing population driven both by improved life expectancy and reduced fertility rates[2], followed by Southern Africa. There is near stagnancy of the share of the ageing population in West and Central Africa, partly contributing to the slow demographic transition witnessed in Africa. Such variations in the ageing population across sub-regions and countries in Africa suggest differences in underlying health systems, formal and informal care systems, and social protection programs.
Figure 1: Growth of the elderly population by sub region in Africa
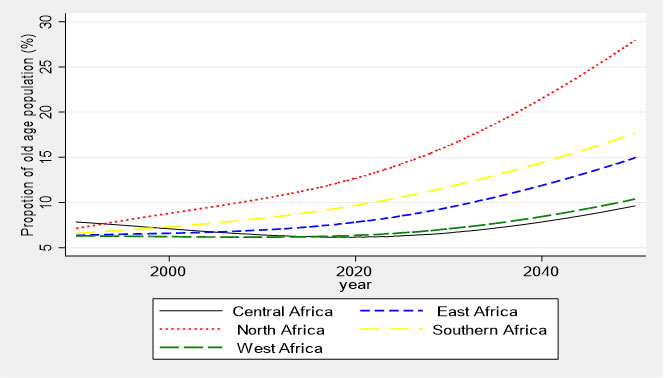
Source: author’s computations based on data from UNFPA
The profile of the ageing population in Africa.
- The ageing population tend to be higher in rural than urban areas in Africa despite exhibiting better life-expectancy, low fertility rates, and relatively better infrastructure.
- Proportion of women elderly is higher than their male counterparts in both rural and urban areas.
- The proportion of the elderly active in the labour market tend to be high in Africa, particularly in Sub Saharan Africa. The labour market participation rate of the elderly in comparison to the participation rate of the work force (15-64) is above 65% for all regions, except North Africa, where this share is less than 40%.
- The variation in the size of the ageing population between African countries could be explained by differences in the level of economic development achieved, life-expectancy at birth attained, and social policies such as public spending on health, social insurance coverage, social contributions, and interpersonal transfers (remittances).
- Key indicators associated with the variations in the size of the ageing population include life expectancy at birth, per capita GDP, labour force mobility and social policies (Table 1).
Table 1: Factors correlated with the ageing population in Africa
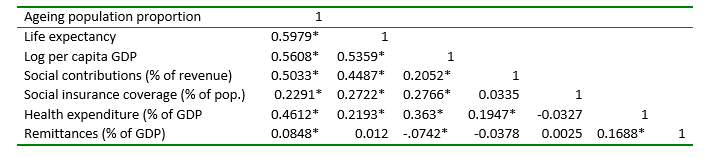
Note: *significant at 5% p-value.
Source: author’s computations based on data from UNFPA and WDI
- Elderly heads of households exhibit higher deprivation rates than the non-elderly in Africa. They tend to have poor access to safe drinking water, sanitation, live in badly constructed houses, exhibit higher degree of malnutrition, and lack access to information (Table 2).
Table 2: Correlation between old (65+) household heads and access to basic social services: 1980-2018
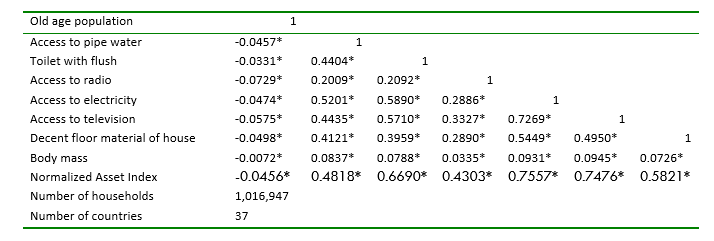
Source: author’s computations based on DHS data
Figure 1: Asset poverty (headcount ratio) is more prevalent among the old-age population in Africa
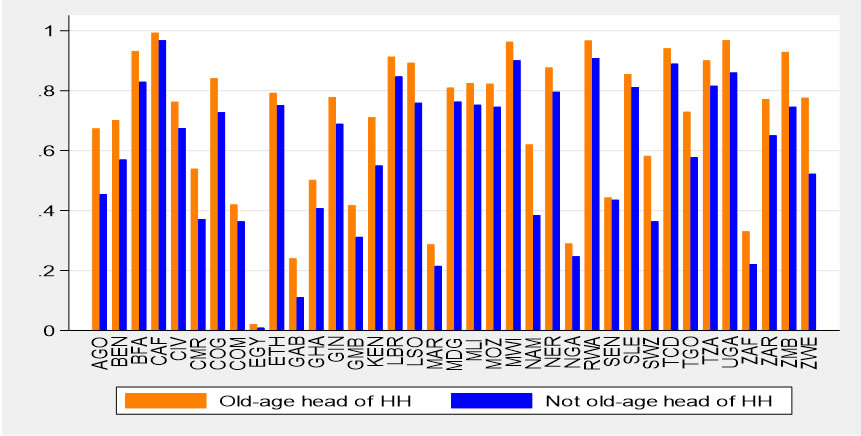
Source: author’s computations based on DHS data
Note: Figure 1 plots by country the proportion of old-age head of households that are asset-poor in comparison with younger age group. The figure is based on computations from DHS data averaged over the period 2000-2018
- The proportion of the asset-poor among the elderly was much higher than those relatively younger households suggesting that the elderly in Africa tend to suffer significantly from lack of basic social services and material needs (Figure 1). However, the degree of deprivation varies considerably across countries, where the proportion of the asset poor tended to be relatively higher in some countries such as Zimbabwe and Zambia relative to the non-elderlies, while the difference is negligible in Central African Republic, Egypt, Nigeria, etc. (Figure 2).
- 24 out of 37 countries asset poverty trended to be higher among the elderly women than elderly men. Such significant gender difference is pronounced in Angola, Zambia, Zimbabwe, and Democratic Republic of Congo. Hence, closing the gender gap alone can contribute significantly to reducing deprivation among the elderly in Africa.
Figure 2: Asset poverty (headcount ratio) between male and female headed elderlies
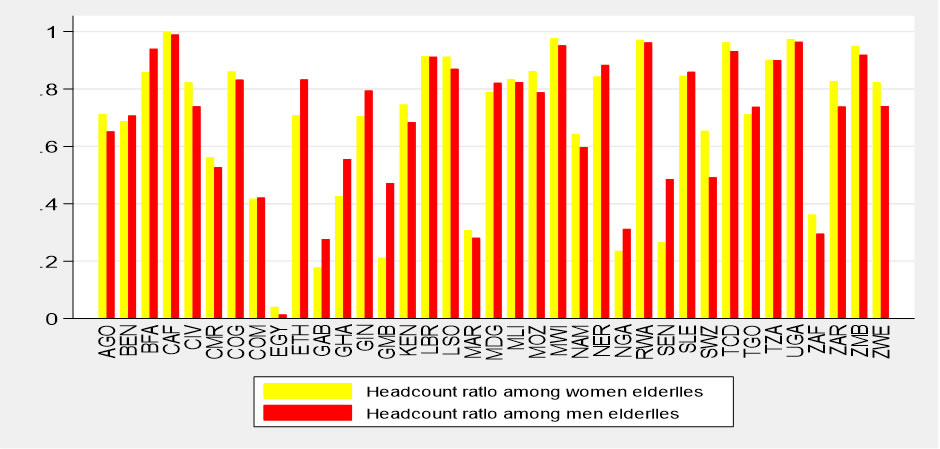
Source: author’s computations based on DHS data
- In conclusion, the ageing population has been increasing both in relative and absolute terms in Africa due to several factors, including improvements in life-expectancy, better economic conditions, changes in fertility rates and implementation of social policies that favour the elderly population.
- Still, poverty and deprivations tend to be more pronounced among the elderly in Africa. Evidence from asset-based poverty indicate that the proportion of elderlies that lacked access to basic services such as safe drinking water, electricity, decent housing, and nutrition tend to be high in all Africa countries suggesting the need for greater effort and policy coordination to implement robust social protection programs.
[1] Author’s computations based on data from UNFPA (2021): https://population.un.org/wpp/
[2] North Africa has the highest migration rates in Africa potentially contributing to the rising share of the elderly population. See https://www.migrationdataportal.org/regional-data-overview/northern-africa
This brief is based on the author’s contribution to a policy paper “Policy Brief on Ageing, Social Protection, and Covid-19 pandemic in Africa”, September 2021, Gender, Poverty and Social Policy Division, UNECA

- The ageing population of Africa is increasing, so it’s suffering - October 10, 2021
- Are social protection programs effective in caring for the elderly in Africa? - October 5, 2021
- For whom the bell tolls? Social Protection in Africa during Covid-19 pandemic - September 30, 2021